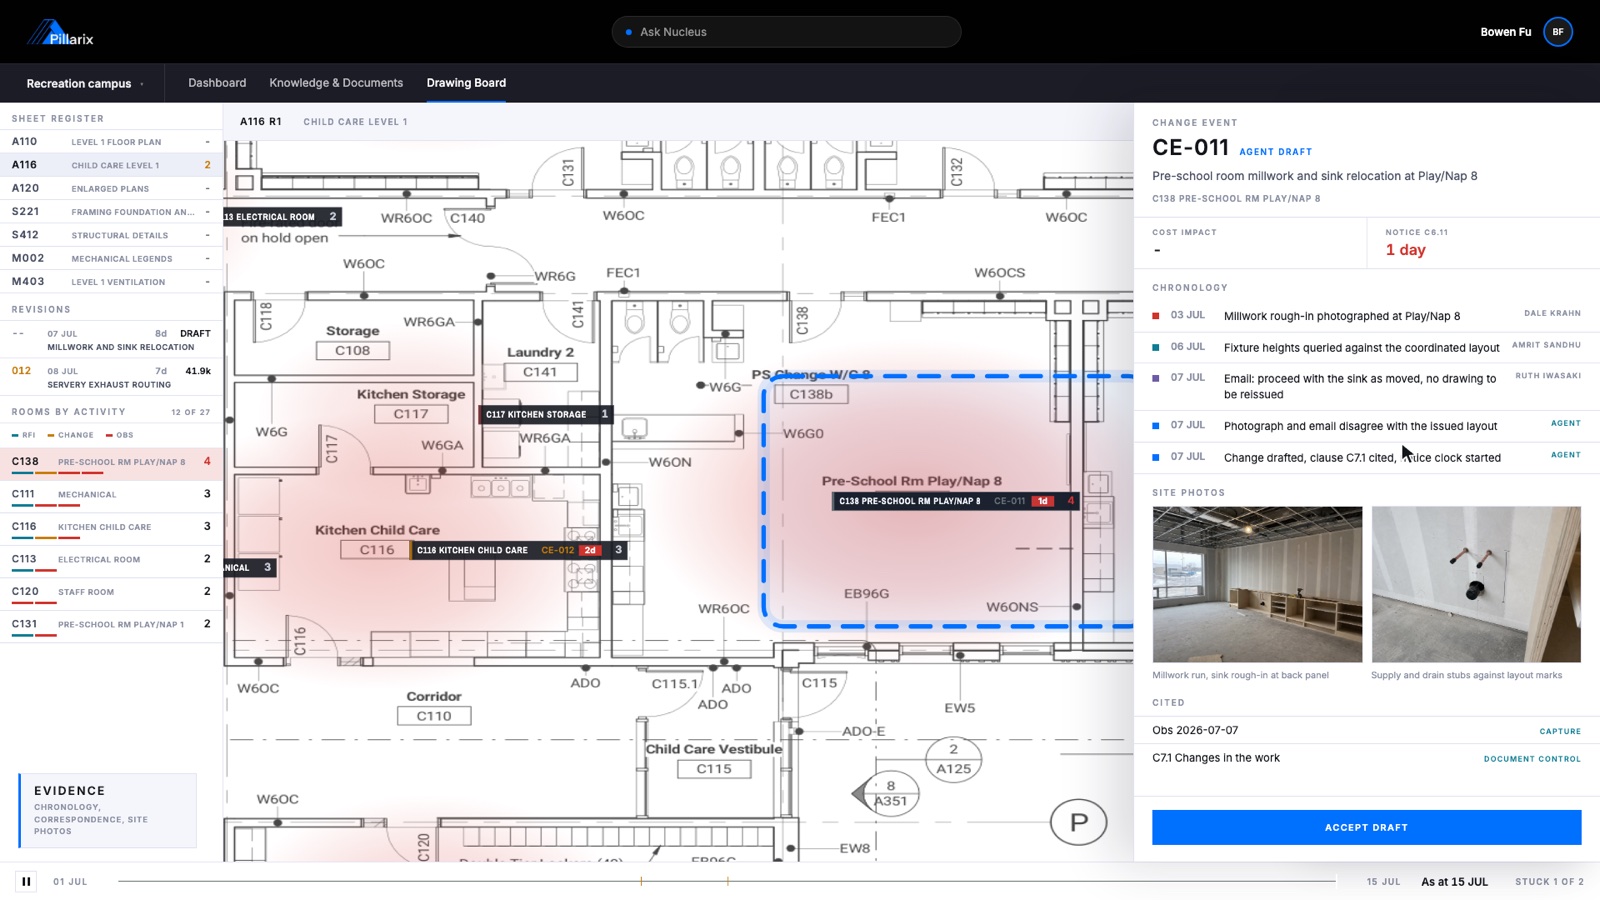
Your whole project's progress, on your drawings.
Every issue, change and open question pinned to where it lives on your own drawings, with the evidence one tap away.
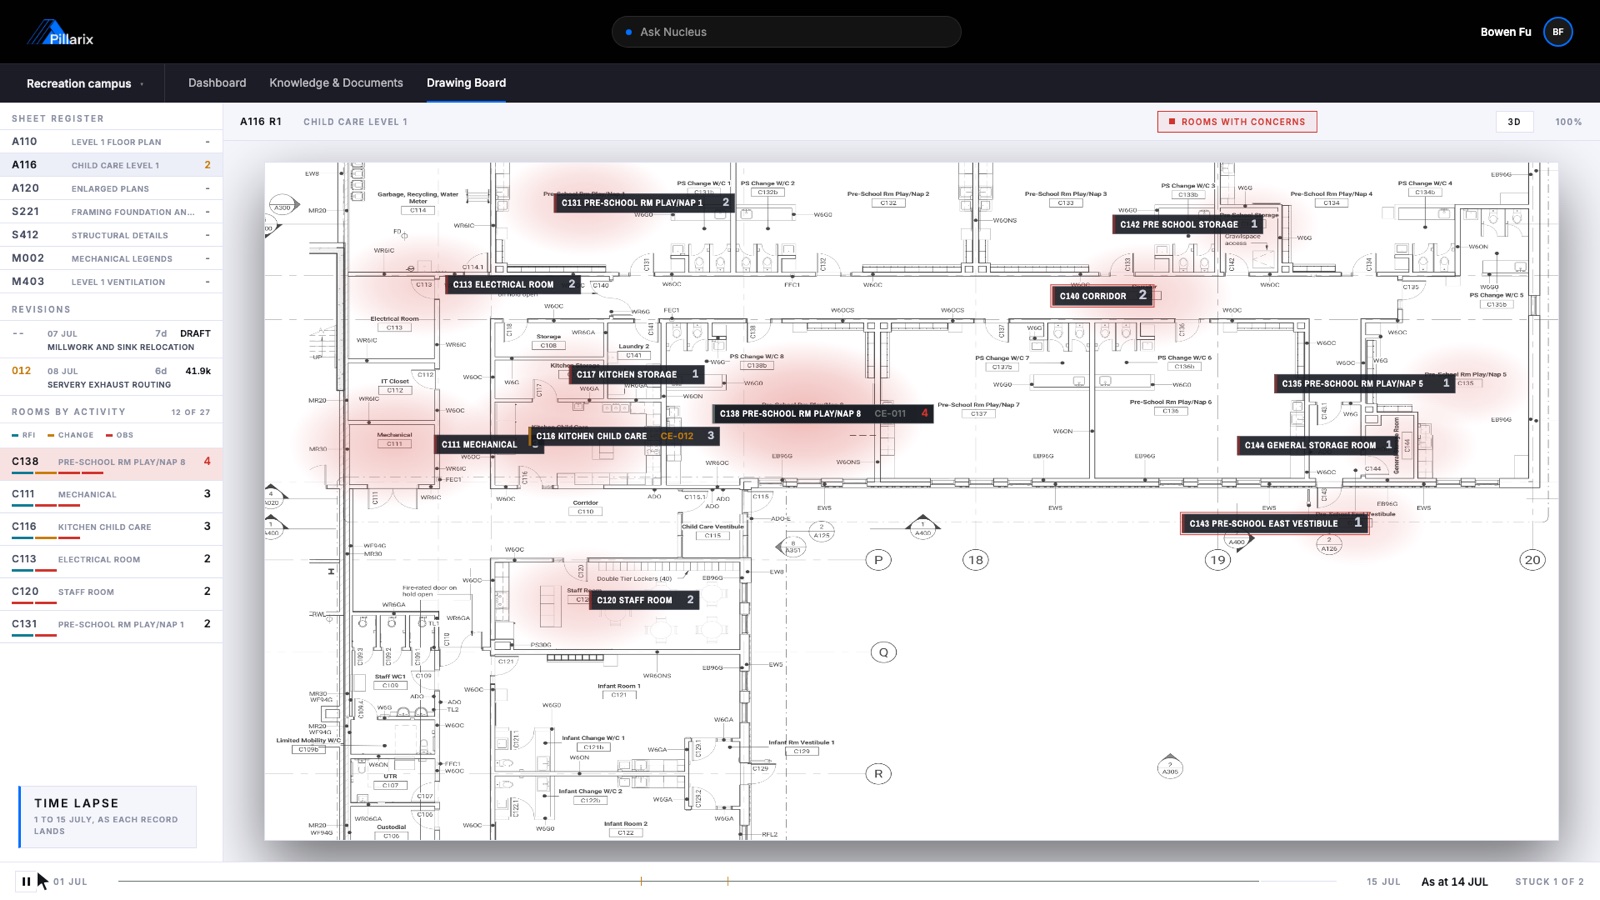
Watch the hotspots form.
Every room, grid, pier and chainage on your drawings is coloured by how much is going on there. Scrub the timeline to see where and when problems started, and filter by change, issue, RFI or open question.
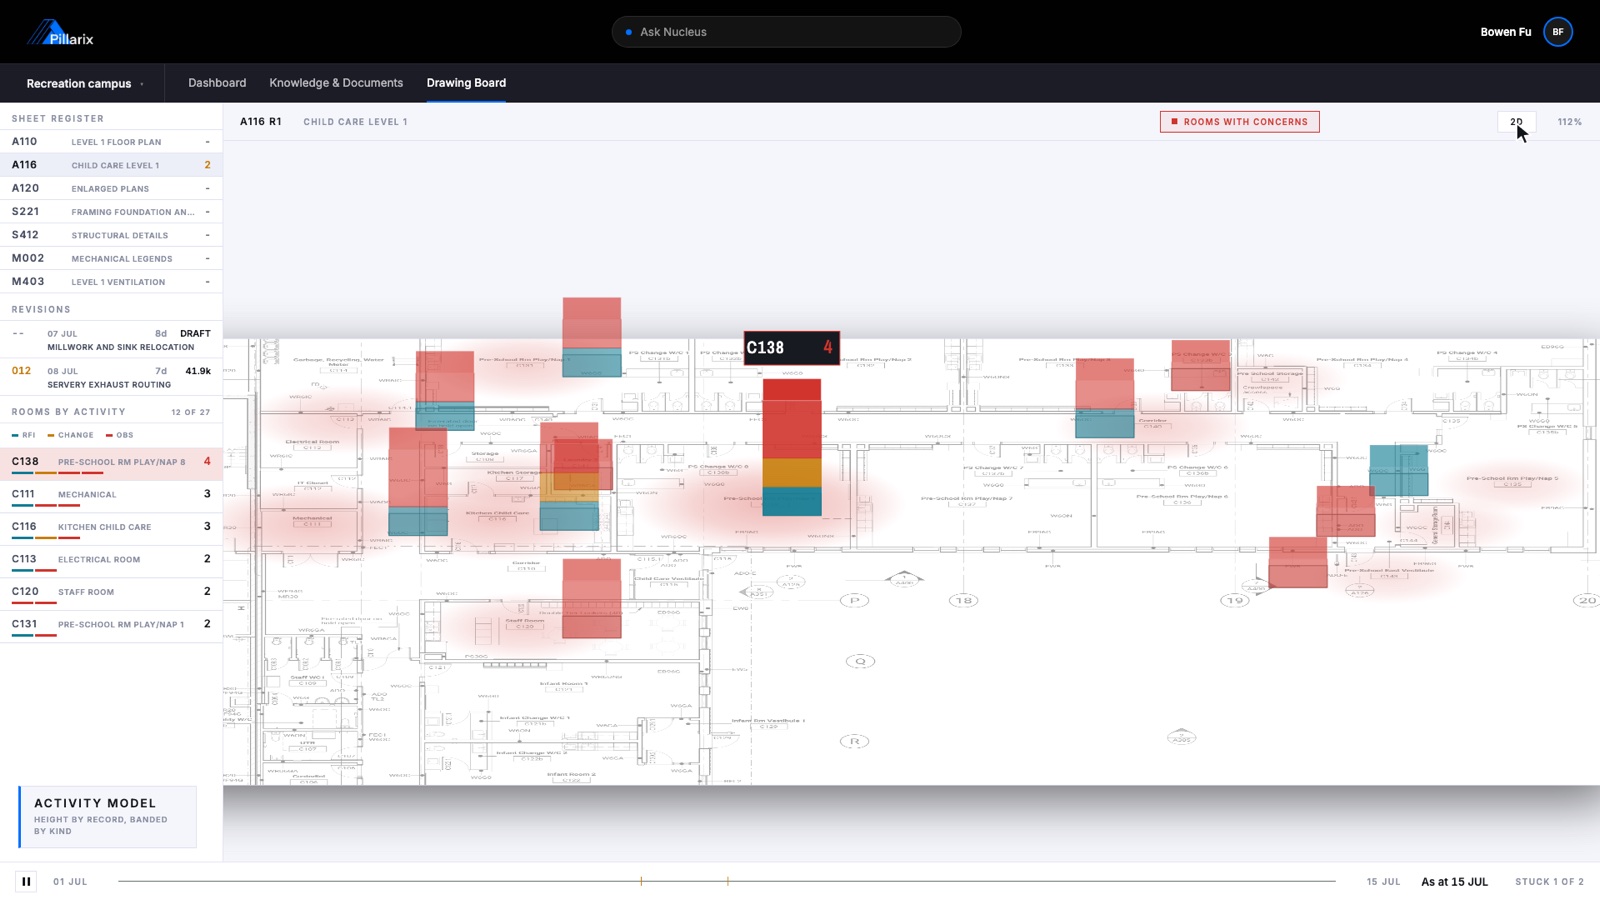
See what needs you today.
Hotspots are ranked by open exposure and nearest deadline, with overdue items flagged on the drawing. One click opens the list of what is open at that location.
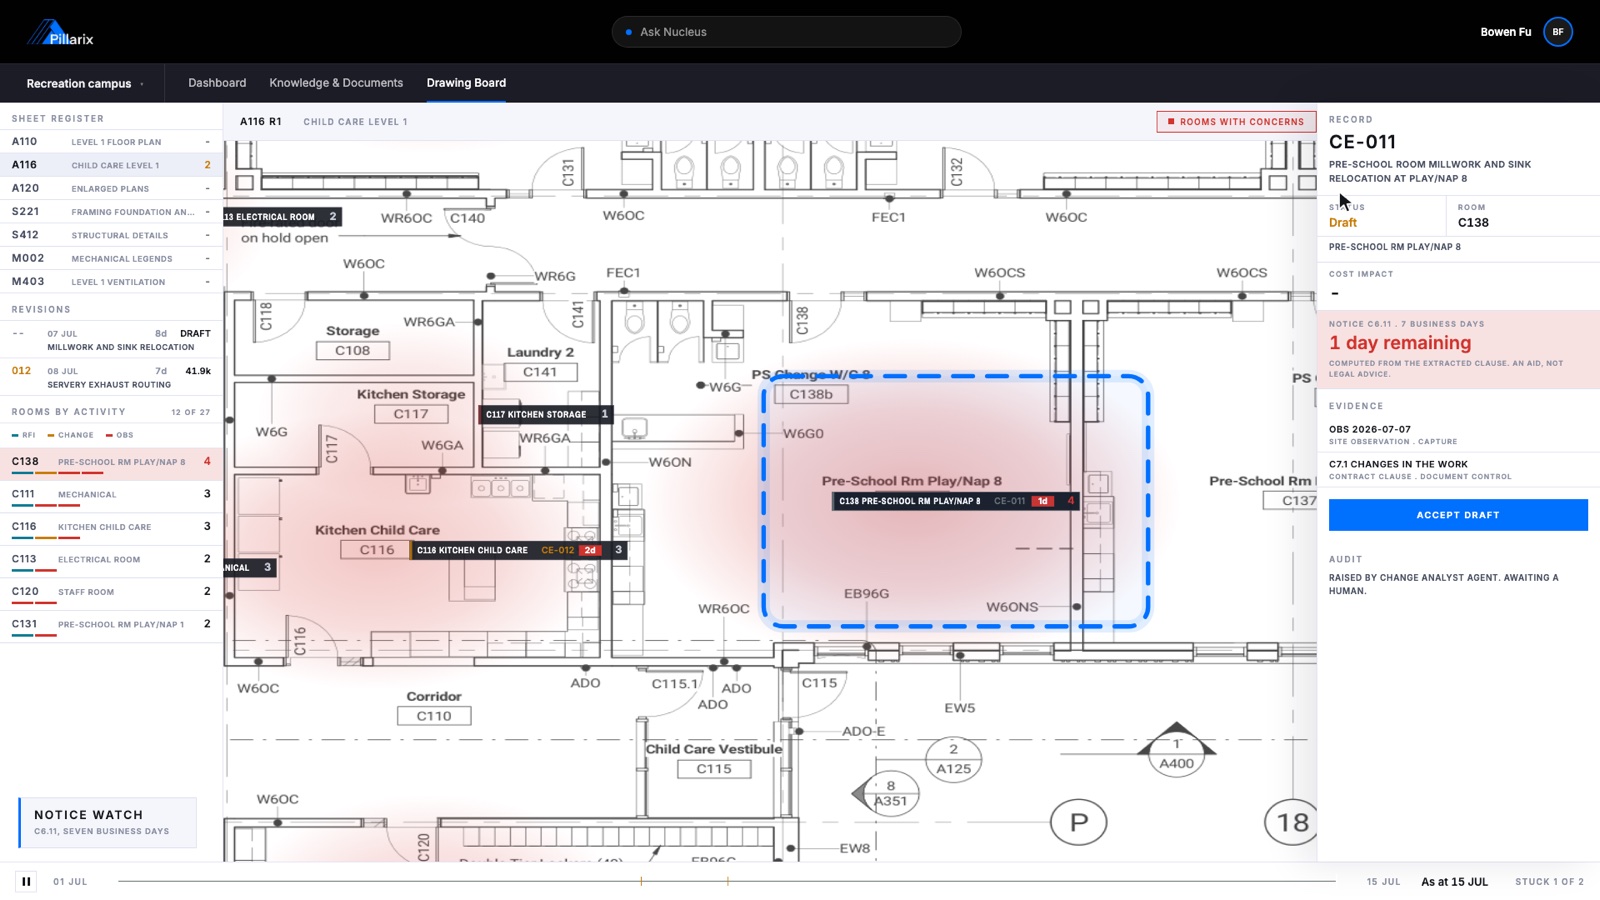
Tap a hotspot. Get the evidence.
Every pin carries the site photo, the email that triggered it, the marked-up revision that changed it, and who has done what since. You can see why grid 9/E is red without opening a folder.